Microscopy
Read about Microscopy
A picture says a thousand words. BioMicroscopy has specialized in visualizing mode of action of enzymes on a range of raw materials, revolutionizing the understanding of how enzymes work and thereby capitalizing use of the same on uncommon substrates. Microscopy can be utilized to document enzyme action to decrease complexity of presenting wet chemistry data to a wider audience (Scientists, sales, marketing, management & investors). Examples of peer reviewed articles visualizing enzyme mode of action: f.eg fiber degradation https://doi.org/10.1371/journal.pone.0251556 degradation of trypsin inhibitors 10.1016/j.anifeedsci.2022.115410, starch solubilization and fiber degradation in cassava root https://www.nature.com/articles/s41598-019-46341-2
I collaborate with scientific experts working at the University of Copenhagen, The Geological Survey of Denmark and Greenland (GEUS) a research and advisory institution in the Danish Ministry of Climate, Energy and Utilities and University of Slovakia who have access to state-of-the-art microscopes to help you with your projects
Below is a light microscopy performed on an Olympus BX41 microscope equipped with a GXCAM HICHROME LITE digital camera and GX CAPTURE software using UPlaN 4 × and 10 × objectives and a phase-contrast Annulus Ph1.

Cross section of Soybean seed as seen using light microscopy.
Scanning electron microscope (SEM) pictures below have been acquired by a ZEISS Sigma 300VP Field Emission SEM showing the presence of opaque white globoids identified as containing Phosphorus (blue) in the globoids in a section of red rice

Scanning electron micrograph of a cross section of red rice showing opaque globoid structures

Identification of phosphorus (P, colored blue) in red rice using X-ray elemental analyses coupled with SEM.
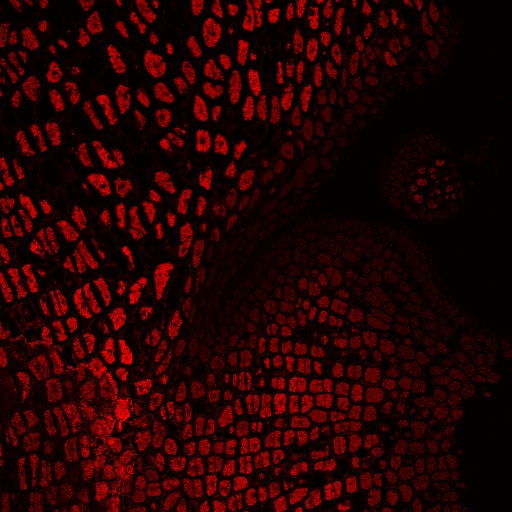
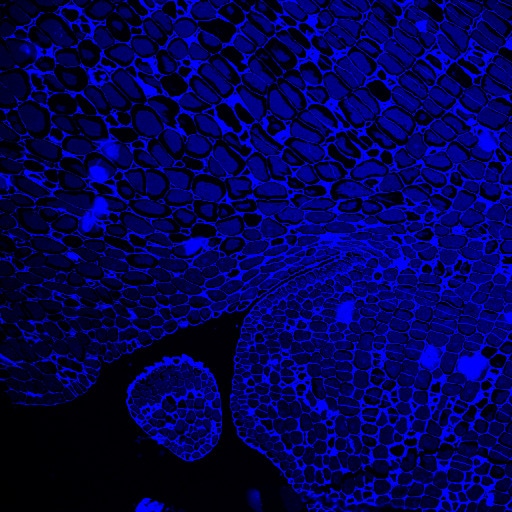
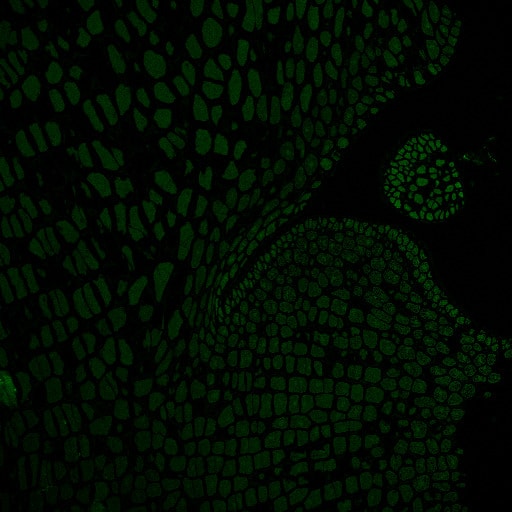
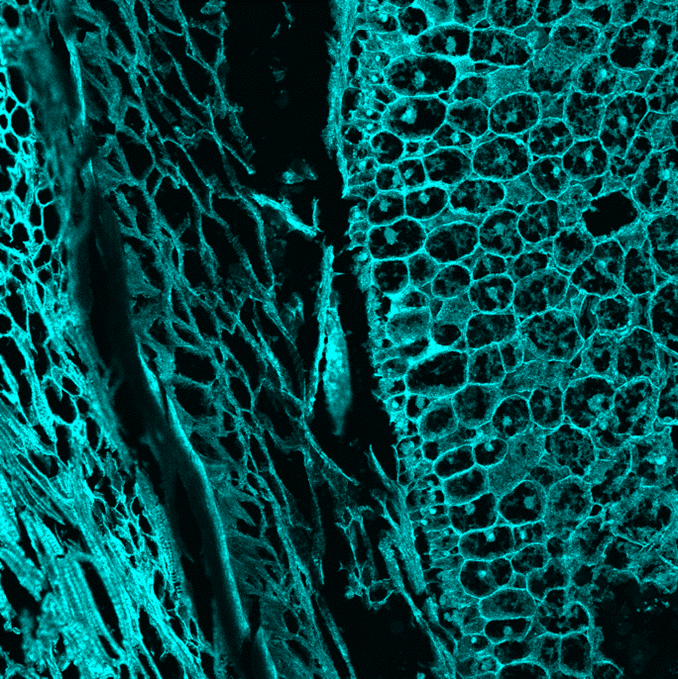
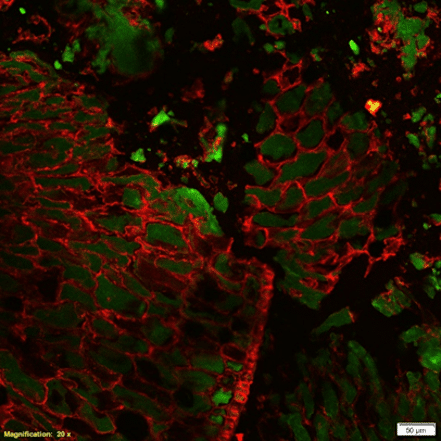
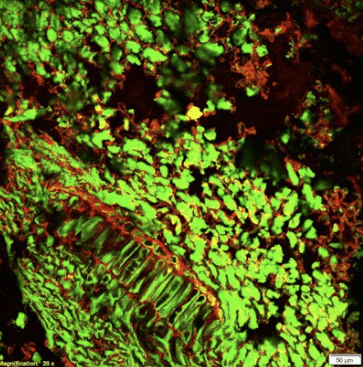
Confocal laser scanning microscopy (CLSM) using TCS SP5x (Leica Microsystems equipped with diode (405 nm), argon (488 nm), and HeNe (543 nm) lasers. See examples below
– In situ analysis which provided new insight into the native distribution of Kunitz Trypsin inhibitor in SB (https://www.sciencedirect.com/science/article/pii/S0377840122002085)

A: Trypsin inhinitor (TI) – dark red circle on the rim protein globoids in soybean

B: Calcofluor (stains vell walls blue) + green autoflurescence (protein) in soybean

C: Overlay of A and B clearly showing Trypsin inhibitor location on the tim of protein globoids